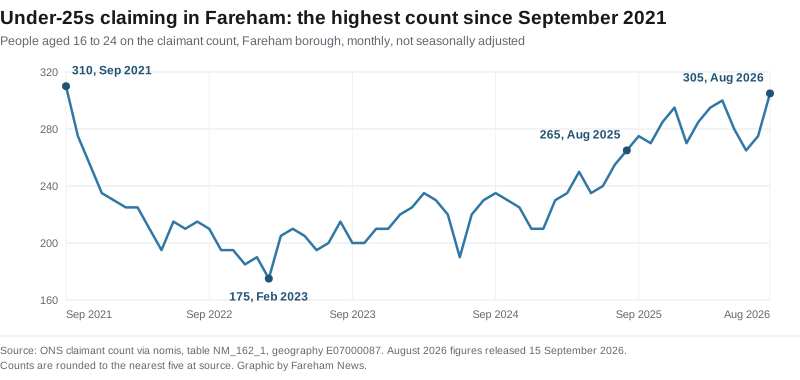

305 under-25s were claiming in Fareham in August, the most since September 2021, while the borough total barely moved. Only Hart has a lower rate in Hampshire.
305 people aged 16 to 24 were claiming unemployment-related benefits in Fareham borough in August, the highest figure in almost five years. The last time the number was higher was September 2021, at 310, when the furlough scheme was still winding down.
The borough total barely moved. It was 1,345 in August, up five on July and up 20 on August 2025. Fareham’s rate is 2.0 per cent of residents aged 16 to 64, where it has sat for most of the past year.
So the headline number is flat and the composition underneath it is not. Between July and August, under-25s rose by 30, claimants aged 25 to 49 fell by 15, to 710, and claimants aged 50 and over fell by 15, to 325.
August always rises for young people. Not by this much
Some of that jump is the calendar. School and college leavers who do not go straight into work or further study turn up in the August count every year.
The size of it is the part worth noticing. In each of the four previous years the Fareham under-25 count rose between July and August by 5 to 15. This year it rose by 30.
- 2022: 210 in July, 215 in August, up 5
- 2023: 200 in July, 215 in August, up 15
- 2024: 220 in July, 230 in August, up 10
- 2025: 255 in July, 265 in August, up 10
- 2026: 275 in July, 305 in August, up 30
The underlying trend was already climbing. The low point in this series was 175 in February 2023. The count has risen in most months since, reaching 265 by August 2025 and 305 now, an increase of 130 on the February 2023 floor.
These figures are not seasonally adjusted, and the counts are rounded to the nearest five where they are published.
Where Fareham sits in Hampshire
For the borough as a whole, the picture is comparatively good.
Fareham’s 2.0 per cent is the joint second lowest of Hampshire’s eleven districts. Only Hart, at 1.8 per cent, is lower. Test Valley is level with Fareham.
| District | Rate, August 2026 | Claimants |
|---|---|---|
| Hart | 1.8% | 1,105 |
| Fareham | 2.0% | 1,345 |
| Test Valley | 2.0% | 1,610 |
| East Hampshire | 2.1% | 1,565 |
| Winchester | 2.1% | 1,700 |
| Eastleigh | 2.3% | 2,010 |
| New Forest | 2.3% | 2,215 |
| Basingstoke and Deane | 2.7% | 3,325 |
| Rushmoor | 3.0% | 2,090 |
| Havant | 3.3% | 2,445 |
| Gosport | 3.6% | 1,795 |
The contrast with the coast next door is stark. Gosport, whose only land boundary is with Fareham, has the highest claimant rate in Hampshire at 3.6 per cent, nearly double Fareham’s. Havant, further east, is at 3.3 per cent. Of the three, Fareham has both the lowest rate and the smallest number of claimants.
What this number is, and what it is not
The claimant count is not the unemployment rate, and treating it as one gets the borough wrong in both directions.
The Office for National Statistics puts it plainly in its quality and methodology information: “The Claimant Count does not attempt to measure unemployment, which is a concept defined by the International Labour Organisation (ILO) as all those who are out of work, actively seeking work and available to start work.”
What it does measure is “the number of people claiming benefits principally for the reason of being unemployed”. The ONS describes it as “a composite of the number of people claiming Jobseeker’s Allowance (JSA) and those claiming Universal Credit (UC) who are required to seek work to qualify for their benefits”. That second group includes some people who are already working, on low earnings, and are still required to look for more.
One more caveat that matters if you compare these figures with a previous month’s report. The ONS says the Universal Credit part of the count “allows for revisions to the data for one previous month”, so the most recent month in any release is the one most likely to move. August’s 1,345 may not be 1,345 by the time the September figures come out.
What it means for you
- If you are under 25 and out of work in Fareham, you are in a bigger group than at any point in nearly five years. That is worth knowing when you are told the local labour market is tight.
- If you employ people here, the pool of young jobseekers in the borough has grown by a third in two years, from 230 in August 2024 to 305 now.
- If you are comparing towns, Fareham’s rate is among the lowest in Hampshire, and the borough immediately to the south has the highest. Averages across “the Solent” conceal that.
- Vacancies placed by local employers are on our Fareham jobs page.
- The other monthly measure of the local economy is the Land Registry house price release. Our Fareham house prices page tracks it.
The next monthly claimant count release will update these figures and may revise August’s.
Sources
- ONS claimant count via nomis, dataset NM_162_1, geography E07000087 (Fareham) and the eleven Hampshire districts under E10000014. Figures pulled 21 September 2026; the dataset records the August 2026 data as released at 07:00 on 15 September 2026. Counts are for all claimants aged 16 and over, both sexes; the rate is the proportion of residents aged 16 to 64. Age bands used are 16 to 24, 25 to 49 and 50 and over.
- Claimant Count QMI, Office for National Statistics, for the definition, the JSA and Universal Credit composition and the revisions policy.
Have your say